I continue my publications on analytics:
- A Data Analysis in business - BI system and visualisation
- Analyses of Product Metrics
- А/B-tests - Part 1/3(AA-test)
- А/B-tests - Part 2/3(AB-test)
- A/B-tests - Part 3/3 (relationship metrics)
- Building an ETL-Pipeline (Airflow)
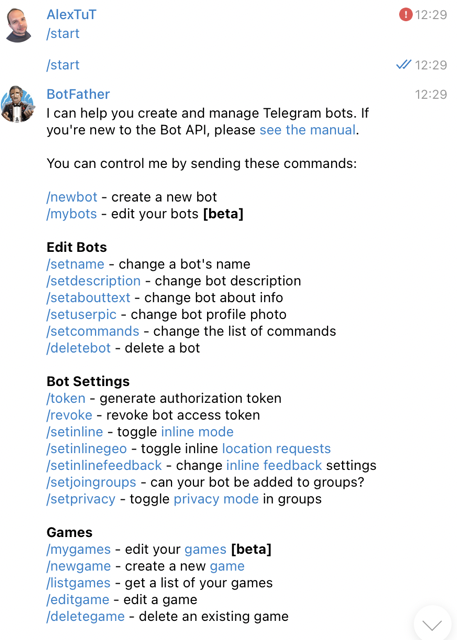
In this series of articles, we will deal with the automation of basic reporting. We will set up automatic sending of the report in a telegram. How to create a bot:
- First, let’s create our own telegram bot using @BotFather.
- Click on start and send the command /newbot.
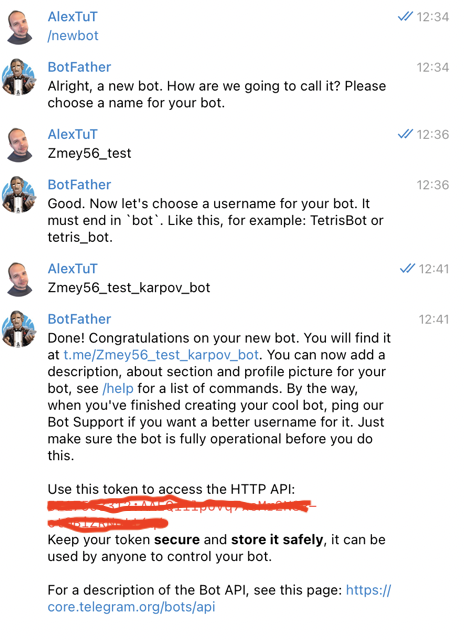
- Next, we will enter the name of the future bot (my neme - Zmey56_test). The name may not be unique, it can be changed.
- Then enter the nickname of the bot. The nickname must necessarily end with the word “bot” and be unique. It cannot be changed.
Now we need to find the chat_id to which the bot will send information. It is important to note that telegram is configured so that chat_id has a positive value for personal chats, and a negative value for groups. Start a dialogue with the bot to allow him to write in private messages. To do this, follow the link t.me /

Now let’s start managing the bot via python. To do this, you need to install the telegram and python-telegram-bot libraries.
pip install telegram
pip install python-telegram-bot
After that, we will check our bot how it works.
Getting access to the bot
import telegram
import numpy as np
import matplotlib.pyplot as plt
import seaborn as sns
import io
import pandas as pd

my_token = 'token your bot' #
bot = telegram.Bot(token=my_token)
Sending a text message:
chat_id = -1001592565485
msg = 'Hello'
bot.sendMessage(chat_id = chat_id, text = msg)
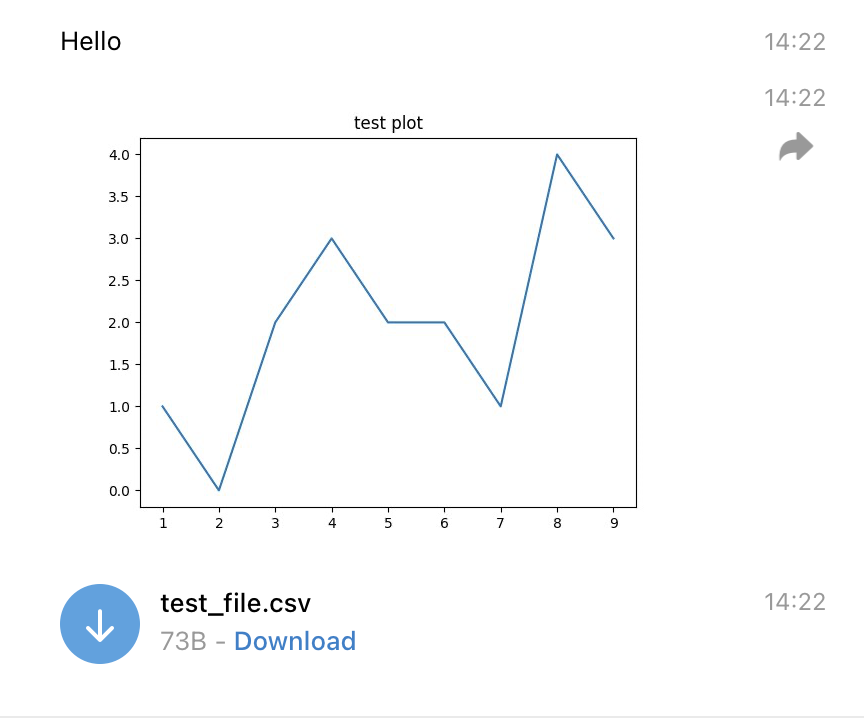
Sending an image:
x = np.arange(1, 10, 1)
y = np.random.choice(5, len(x))
sns.lineplot(x, y)
plt.title('test plot')
plot_object = io.BytesIO()
plt.savefig(plot_object)
plot_object.seek(0)
plot_object.name = 'test_plot.png'
plt.close()
bot.sendPhoto(chat_id=chat_id, photo = plot_object)
Sending a file:
data = Getch('select * from simulator.feed_actions where toDate(time) = today() limit 100').df
file_object = io.StringIO()
data.to_csv(file_object)
file_object.name = 'test_file.csv'
file_object.seek(0)
bot.sendDocument(chat_id=chat_id, document = file_object)
It is important to note that I take the data to form a file from the database that was provided to us. You can generate data from other sources.
Result in my group:
Now let’s go directly to the task. It included setting up automatic sending of a report in a telegram every morning. The report should contain:
- a text with information about the values of key metrics (DAU, Views, Likes, CTR) for the previous day
- a graph with the values of metrics for the previous 7 days
Let’s write the main function that will collect the report:
def feed_report(chat=None):
chat = chat or chat_id
bot = telegram.Bot(token=my_token)
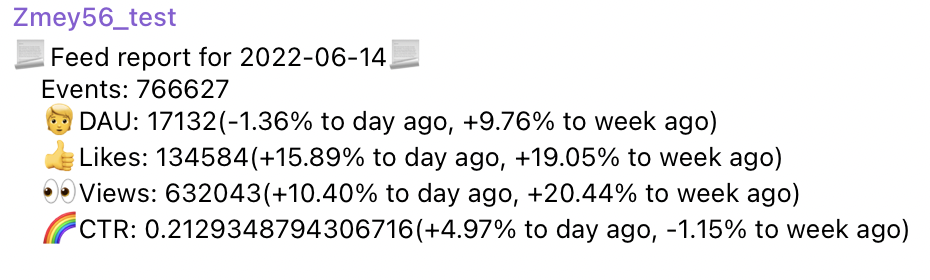
msg = """ 📃Feed report for {date}📃
Events: {events}
🧑DAU: {users}({to_users_day_ago:+.2%} to day ago, {to_users_week_ago:+.2%} to week ago)
👍Likes: {likes}({to_likes_day_ago:+.2%} to day ago, {to_likes_week_ago:+.2%} to week ago)
👀Views: {views}({to_views_day_ago:+.2%} to day ago, {to_views_week_ago:+.2%} to week ago)
🌈CTR: {ctr}({to_ctr_day_ago:+.2%} to day ago, {to_ctr_week_ago:+.2%} to week ago)
"""
query = """
select
toDate(time) as date
,count(distinct user_id) as DAU
,countIf(action='like') as likes
,countIf(action='view') as views
,countIf(action='like') / countIf(action='view') as CTR
,likes+views as events
from simulator_20220620.feed_actions
where toDate(time) between today() - 8 and today() - 1
group by date
order by date
"""
data = pd.DataFrame(ph.read_clickhouse(query=query, connection=connection))
today = pd.Timestamp('now') - pd.DateOffset(days=1)
day_ago = today - pd.DateOffset(days=1)
week_ago = today - pd.DateOffset(days=7)
data['date'] = pd.to_datetime(data['date']).dt.date
data = data.astype({'DAU':int, 'views':int, 'likes':int, 'events':int})
report = msg.format(date = today.date(),
events = data[data['date'] == today.date()]['events'].iloc[0],
users =data[data['date'] == today.date()]['DAU'].iloc[0],
to_users_day_ago = (data[data['date'] == today.date()]['DAU'].iloc[0]
- data[data['date'] == day_ago.date()]['DAU'].iloc[0])
/data[data['date'] == day_ago.date()]['DAU'].iloc[0],
to_users_week_ago = (data[data['date'] == today.date()]['DAU'].iloc[0]
- data[data['date'] == week_ago.date()]['DAU'].iloc[0])
/data[data['date'] == week_ago.date()]['DAU'].iloc[0],
likes=data[data['date'] == today.date()]['likes'].iloc[0],
to_likes_day_ago=(data[data['date'] == today.date()]['likes'].iloc[0]
- data[data['date'] == day_ago.date()]['likes'].iloc[0])
/data[data['date'] == day_ago.date()]['likes'].iloc[0],
to_likes_week_ago=(data[data['date'] == today.date()]['likes'].iloc[0]
- data[data['date'] == week_ago.date()]['likes'].iloc[0])
/data[data['date'] == week_ago.date()]['likes'].iloc[0],
views=data[data['date'] == today.date()]['views'].iloc[0],
to_views_day_ago=(data[data['date'] == today.date()]['views'].iloc[0]
- data[data['date'] == day_ago.date()]['views'].iloc[0])
/data[data['date'] == day_ago.date()]['views'].iloc[0],
to_views_week_ago=(data[data['date'] == today.date()]['views'].iloc[0]
- data[data['date'] == week_ago.date()]['views'].iloc[0])
/data[data['date'] == week_ago.date()]['views'].iloc[0],
ctr=data[data['date'] == today.date()]['CTR'].iloc[0],
to_ctr_day_ago=(data[data['date'] == today.date()]['CTR'].iloc[0]
- data[data['date'] == day_ago.date()]['CTR'].iloc[0])
/data[data['date'] == day_ago.date()]['CTR'].iloc[0],
to_ctr_week_ago=(data[data['date'] == today.date()]['CTR'].iloc[0]
- data[data['date'] == week_ago.date()]['CTR'].iloc[0])
/data[data['date'] == week_ago.date()]['CTR'].iloc[0]
)
bot.sendMessage(chat_id=chat_id, text=report)
After executing this code, the following report comes to our group:
Now let’s build graphs for our report:
def get_plot(data):
    fig, axes = plt.subplots(2, 2, figsize = (16 , 10))
    # fig.subtitle("Feed statistics for the previous 7 days")

    plot_dict = {(0,0):{'y':'DAU', 'title': 'Unique users'},
                (0,1):{'y':'likes', 'title': 'Likes'},
                (1,0):{'y':'views', 'title': 'Views'},
                (1,1):{'y':'CTR', 'title': 'CTR'}}

    for i in range(2):
        for j in range(2):
            sns.lineplot(ax=axes[i,j], data=data, x='date', y=plot_dict[(i,j)]['y'])
            axes[i, j].set_title(plot_dict[(i,j)]['title'])
            axes[i, j].set_xlabel(None)
            axes[i, j].set_ylabel(None)
            for ind, label in enumerate(axes[i, j].get_xticklabels()):
                if ind % 3 == 0:
                    label.set_visible(True)
                else:
                    label.set_visible(False)

    plot_object = io.BytesIO()
    plt.savefig(plot_object)
    plot_object.name = 'feed_stat.png'
    plot_object.seek(0)
    plt.close()

    return plot_object
Next, I will add the following code to the end of the feed_report function:
plot_object = get_plot(data)
bot.sendPhoto(chat_id=chat_id, photo=plot_object)
After a test check of my code, I get the following graph in my group:
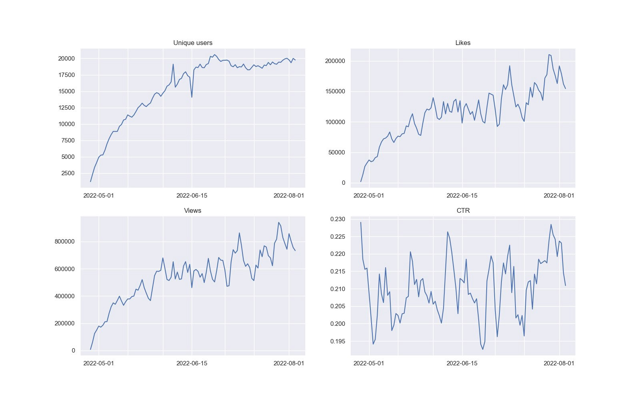
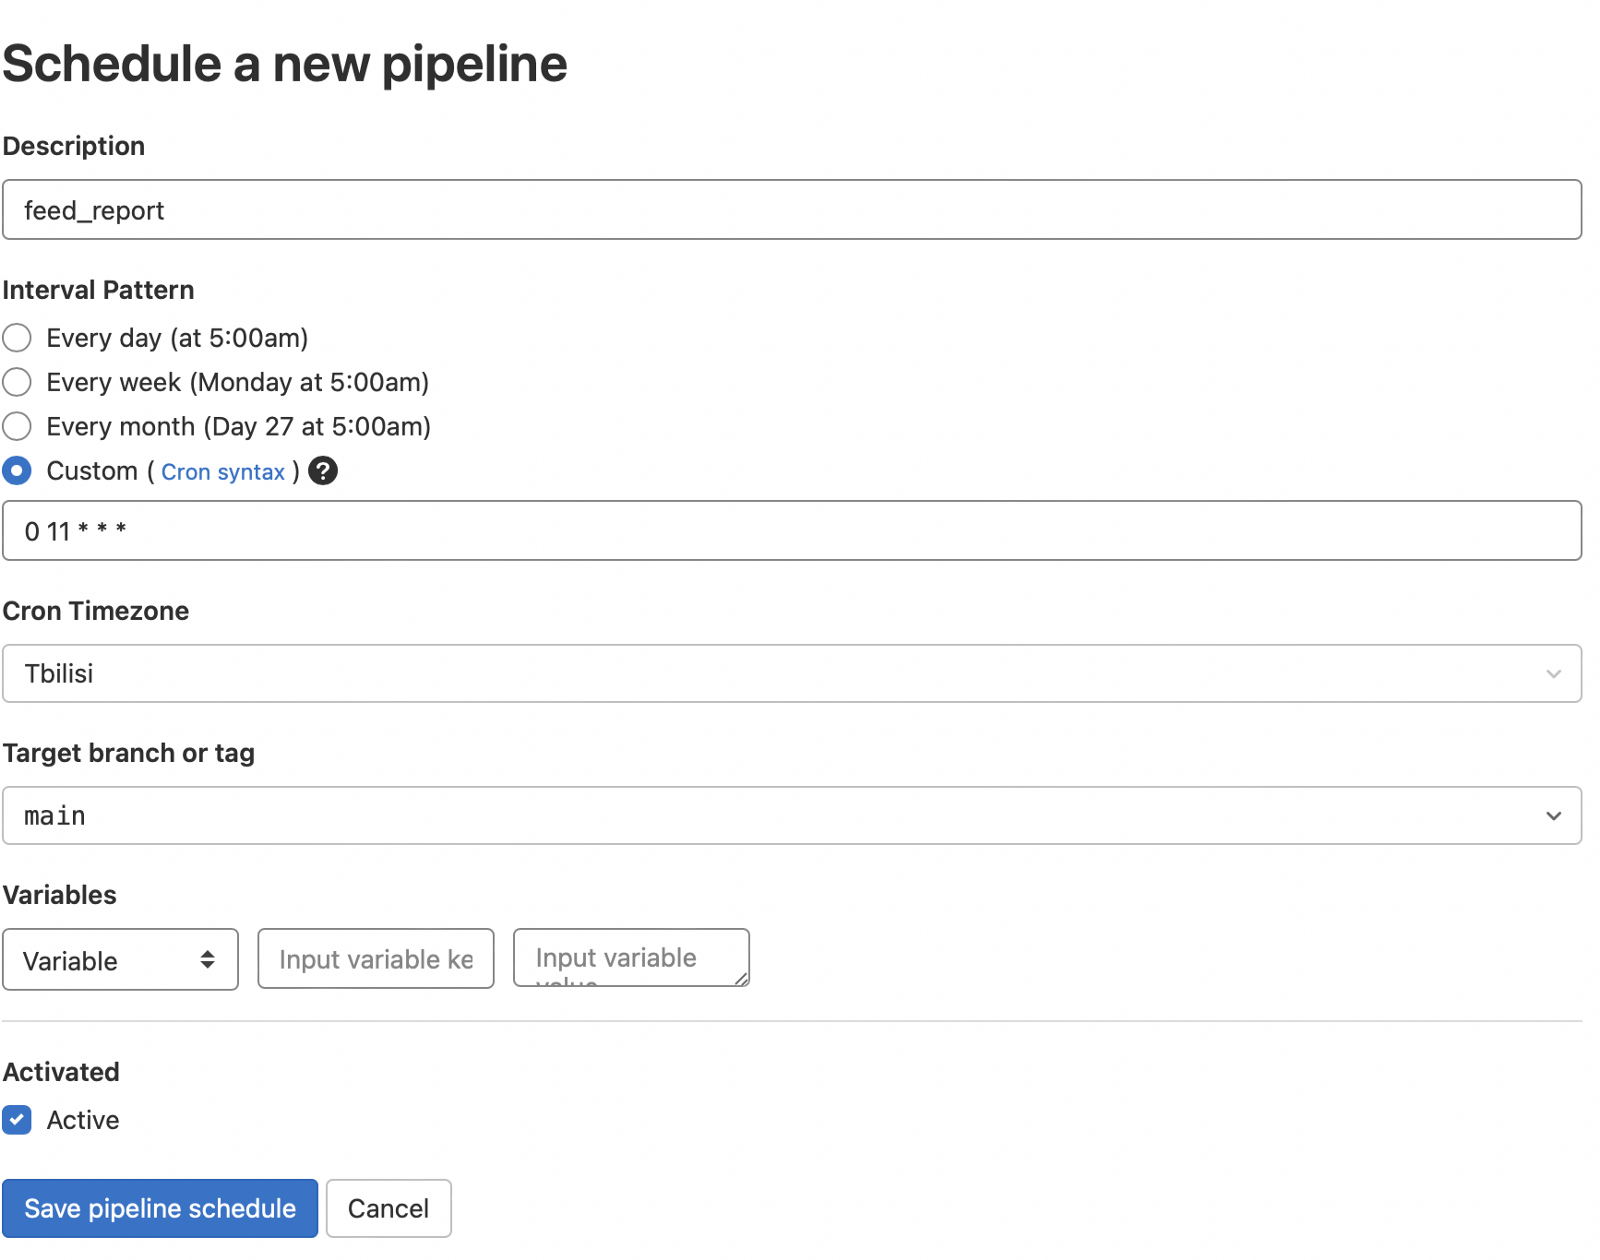
We have combined four graphs into one in order to exclude separate messages for each graph and not annoy users. For automation this time we will use GitLab CI/CD. It is better to read about how to work with this system in the official documentation. You also need to know what dockers are. In order for the token of our bot not to be visible in the public domain, it is desirable to hide it. To hide the bot token, you need to act according to the following algorithm:
- In GitLab, go to Settings -> CI/CD -> Variables
- Add a secret variable by specifying its name and value
- In the code, import the os library and replace the value of the secret variable with the string os.environ.get(“REPORT_BOT_TOKEN”)
bot = telegram.Bot(token=os.environ.get("REPORT_BOT_TOKEN"))
After that, upload the file to our repository and go to CI/CD -> Editor, where we press the Configure pipeline key. After that, we will be offered a template. We will clean it up and create our own. I use the docker image from the course, the stages will be init and run. Let’s call the job feed_report_job:
image: cr.yandex/crp742p3qacifd2hcon2/practice-da:latest

stages:
  - init
  - run


feed_report_job:
    stage: run
    script:
        - python main.py
    only:
        - schedules
Next, go to the schedule and create a schedule for sending reports. I chose 11 am time in Tbilisi (Georgia).
After that, you can force start by clicking on the play(triangle) button and see the report in your group.
This concludes this article, in the next part we will continue to deal with the automation of reports.